 You are working with the text-only light edition of "H.Lohninger: Teach/Me Data Analysis, Springer-Verlag, Berlin-New York-Tokyo, 1999. ISBN 3-540-14743-8". Click here for further information.
 You are working with the text-only light edition of "H.Lohninger: Teach/Me Data Analysis, Springer-Verlag, Berlin-New York-Tokyo, 1999. ISBN 3-540-14743-8". Click here for further information. You are working with the text-only light edition of "H.Lohninger: Teach/Me Data Analysis, Springer-Verlag, Berlin-New York-Tokyo, 1999. ISBN 3-540-14743-8". Click here for further information.
|
Table of Contents  Multivariate Data Multivariate Data  Modeling Modeling  PCA PCA  PCA - Model Order PCA - Model Order |
|
| See also: PCA |   |
After performing the eigenanalysis of either the scatter, the covariance, or the correlation matrix, we end up with a set of principal components (PCs) with decreasing systematic variation, and increasing non-systematic variation (noise). In order to set up a model based on principal components, one has to determine the border between useful information and noise. Including too many PCs will result in overfitting, but using too few components will corrupt the model (simplify it too much).
Basically, there are two methods to find the optimum number of PCs:
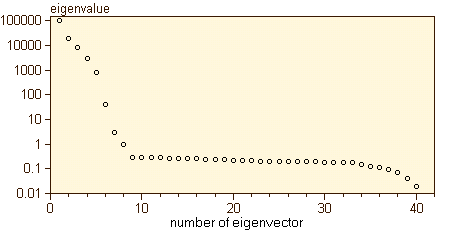
(1) Plotting the eigenvalues against their number: if we plot the eigenvalues against their number, we get a diagram similar to that in the figure below. At first the eigenvalues fall off sharply becoming more or less constant after a certain number. This number of important eigenvectors (those whose value is greater than 1.0) indicates the rank of the matrix, or in other words, the order of the model. Eigenvectors beyond the fall-off should be omitted, since they usually contain the noise of the data.

(2) Plotting the PRESS value of a
reconstructed model: If the number of selected eigenvectors is adequate,
the data can be reconstructed from the chosen set of eigenvectors. The
quality of the reconstructed data could be measured by calculating, e.g.
the PRESS, depending on the number of eigenvectors used for the model.
This curve clearly indicates how many eigenvectors are necessary to build
a reliable model with a minimum amount of noise in it.
Last Update: 2006-Jšn-17